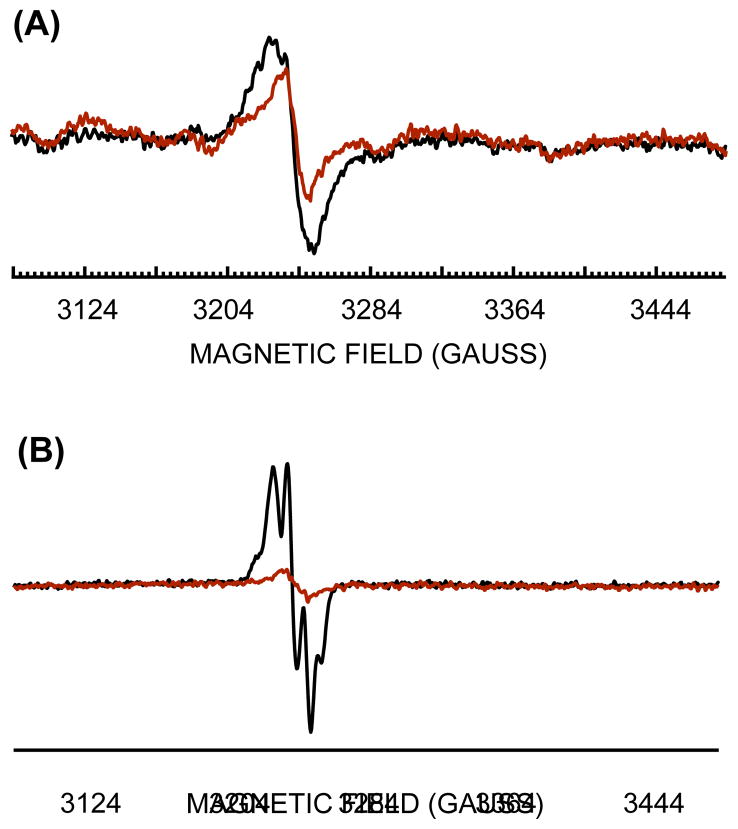
Figure 7. EPR spectra of NrdF expressed in iron-deficient and iron-replete cells.
(A) Iron-deficient (ΔtonB ΔfeoABC ΔzupT) cells with (JEM1121, black) or without (JEM865, red) plasmid pBAD-N-S-2-nrdF. Cells were cultured in aerobic MOPS glucose/amino acids medium, and arabinose was added for 2 hours before harvesting and whole-cell EPR analysis. (B) Iron-replete wild-type cells harboring pBAD-N-S-2-nrdF (JEM1033) were cultured in aerobic LB medium, and arabinose was added for two hours before harvesting and whole-cell EPR analysis (black). Red: 160 mM hydroxyurea was added for 1 hour after nrdF expression prior to EPR analysis.

