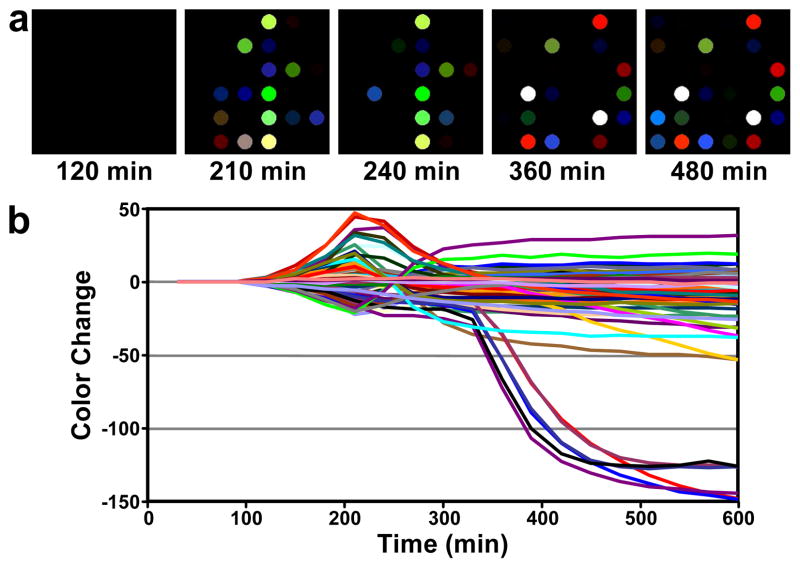
Figure 2.
Color difference maps and time response profile resulting from colorimetric sensor array exposure to a growing culture of E. coli, American Type Culture Collection (ATCC) #25922. a. The color difference maps (i.e., ΔR, ΔG, ΔB) at select times were generated by subtracting the average RGB of each spot from a baseline image (taken at 90 min). For the purpose of effective visualization only, the color range shown in the color range maps is expanded from RGB values of 0–31 to 0–255. b. The color change values versus time plotted for all color channels (ΔR, ΔG, and ΔB values for each spot, i.e., 108 color channels) at each time point.

