Fig. 4.
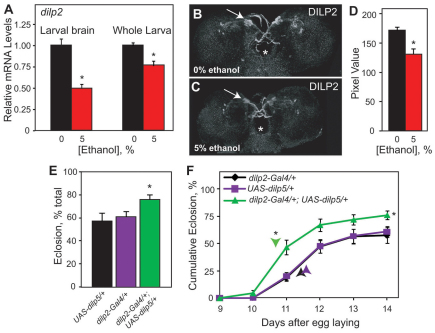
Developmental ethanol exposure alters insulin levels. (A) Developmental ethanol exposure reduces dilp2 expression in larval brain and whole larvae as quantified by qPCR. mRNA levels are expressed as fold difference relative to control larvae (Kruskal-Wallis test, n=3, *P<0.04). (B,C) Dilp2 is reduced in ethanol-reared wandering larvae. (B,C) Representative images of Dilp2 in control (B) and ethanol-reared (C) larvae. Arrows indicate IPCs. Asterisk shows the esophagus. (D) Quantification of Dilp2 in the IPCs (Student’s t-test, n=10–13, *P<0.001). (E) Larval expression of dilp5 in IPCs of the CNS, using dilp2-GAL4, ameliorates the developmental delay and lethality induced by developmental ethanol exposure. Total eclosion (mean + s.e.m.) of dilp5-overexpressing larvae (dilp2-GAL4/+; UAS-dilp5/+) differs from control larvae (dilp2-GAL4/+and UAS-dilp5/+) (one-way ANOVA, with Tukey HSD post-hoc analysis, n=6, *P=0.045).
(F) Cumulative eclosion rates of dilp5-overexpressing larvae differs from control larvae (repeated measures ANOVA, n=6, between groups *P=0.0134, within groups *P=0.001). Time to 50% total eclosion (indicated by arrowheads) differs between dilp5-overexpressing larvae and control larvae (Dunnett’s, n=6, *P<0.001). n corresponds to the number of vials, containing 100 animals each.

