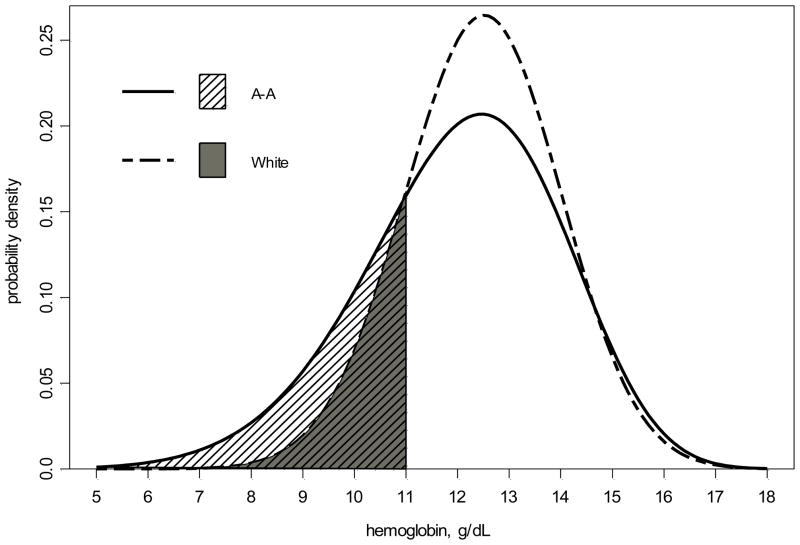
Figure 3.
Univariate, race-specific generalized gamma derived probability density curves of hemoglobin (Hb) with left-censoring for current erythropoietin stimulating agent (ESA) users. The Hb distribution for African-American children [GG(2.55, 0.14, 0.86)] is shown with a solid line; Hb distribution for white children [GG(2.54, 0.12, 0.41)] is shown with a dashed line. The shaded areas show that 28% of African American children (striped area) compared to only 16% of white children (solid grey area) are estimated to have a Hb <11 g/dL.

