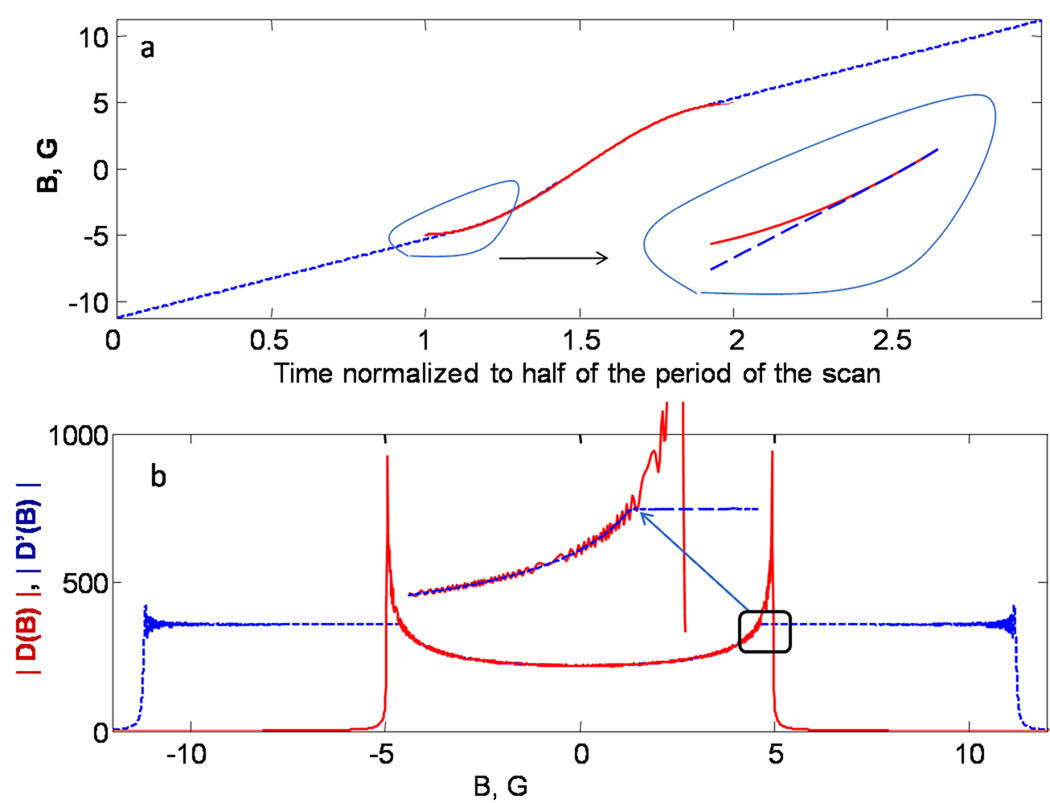
Fig. 1.

(a) The modified magnetic field scan profile (blue dashed line) is compared with the experimental sinusoidal scan (red curve). The insert shows the transition from sinusoidal to linear scan in detail. (b) Absolute value of the Fourier transforms of the driving functions for the sinusoidal (red) |D(B)| and modified field scan profiles (dashed blue) |D’(B)|. The insert shows that |D’(B)| coincides with |D(B)| between about −4.25 and 4.25 G, but does not exhibit oscillatory behavior. To emphasize the correspondence between the y-axis of (a) and the x-axis of (b), both axes are labeled in gauss.
