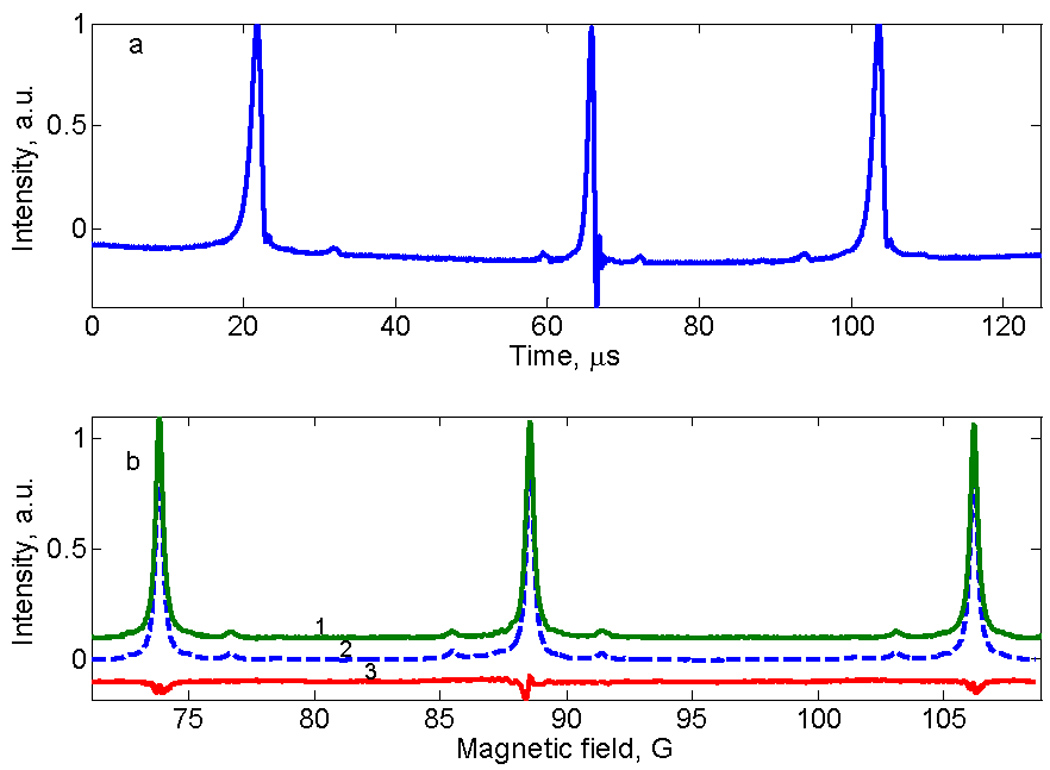
Fig. 6.

EPR spectra of aqueous tempone-d16. a) Down-field half cycle of the sinusoidal rapid scan. b) Comparison of the sum of spectra obtained by deconvolution of up-field and down-field signals (trace 1, green) with CW spectrum (trace 2, blue dashed line), and the difference between traces 1 and 2 (trace 3, red).
