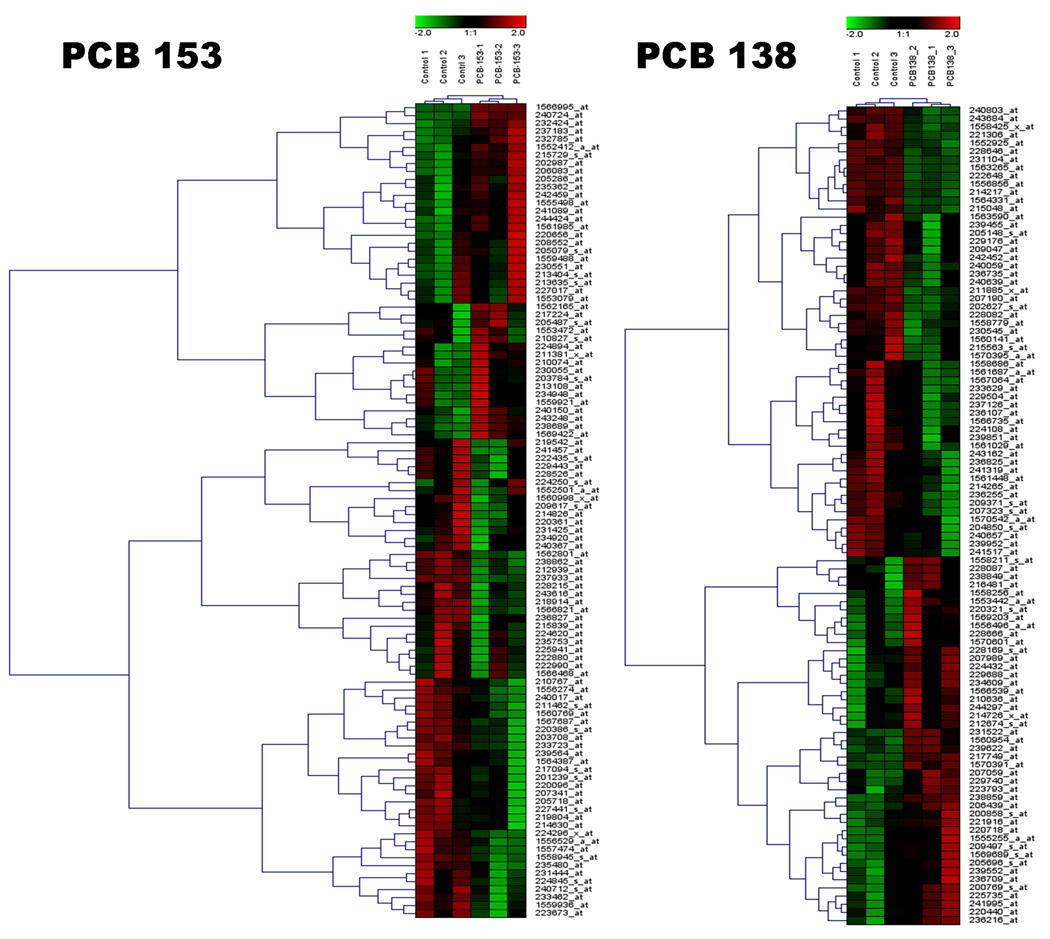
Figure 8.
Heat maps of relative expression changes in human PBMC following PCB 153 and PCB 138 exposures showing relative expression changes in human PBMC following PCB 153 (top 102 genes out of 397, A) and PCB 138 (top 100 genes out of 297, B) exposures. Red denotes up-regulation, black no difference, and green down-regulation; where brighter green is increasingly repressed and red increasingly induced by PCBs. The hierarchical clustering showed that control (column 1–3) and the treated (column 4–6) are grouped together and was based on average linkage with a Pearson correlation.

