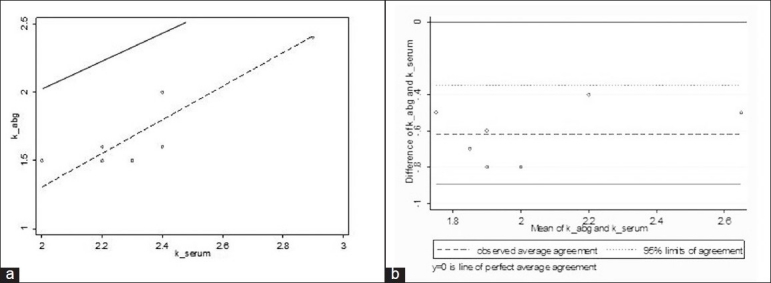
Figure 3.

Relationship between serum potassium and whole blood potassium analyzed for 11 potassium values <3 mmol/L. (a) Concordance plot showing agreement between serum and whole blood potassium samples <3mmol/L. The solid line indicates the line of perfect concordance and the dotted line indicates the best fitted line for our data. (b) Bland and Altman plot depicting the agreement between serum and whole blood values with 95% LOA (small dotted lines) and the observed average agreement (bold dotted lines).The bold line at y = 0 indicates the line of perfect average agreement
