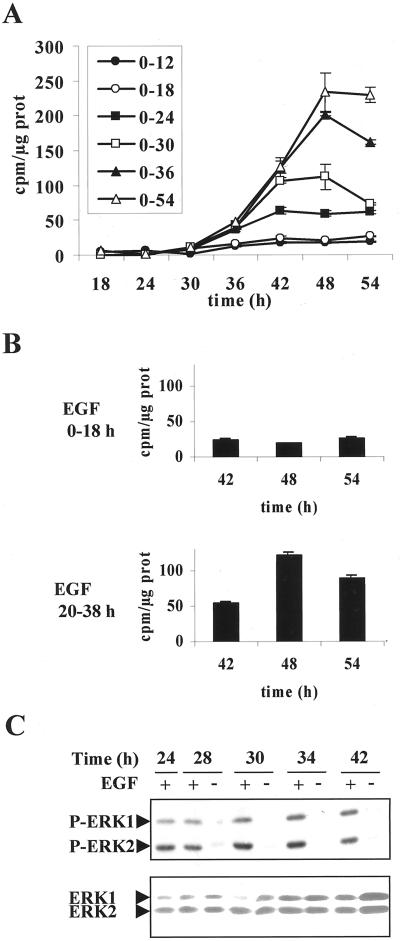
Figure 7.
Sequential induction of EGF-dependent morphogenic and mitogenic effect. (A) Time course of [methyl-3H]thymidine incorporation into DNA after EGF stimulation over different time periods along the G1 phase (0–12, 0–18, 0–24, 0–30, 0–36, and 0–54 h). (B) [methyl-3H]Thymidine incorporation into DNA analyzed at the indicated times in hepatocytes stimulated by EGF for 18 h at two different times (EGF 0–18 and 20–38 h) during G1 phase progression. (C) Kinetics of EGF-induced ERK1/2 phosphorylation in hepatocytes stimulated by EGF throughout the 42 h of culture (+) or only during the first 24 h (−) and analyzed by Western blot at the indicated times. After stripping, a mixture of equal ratios of anti-ERK1 and anti-ERK2 antibodies was used to detect total ERK1/2 proteins. These data are representative of three different experiments.

