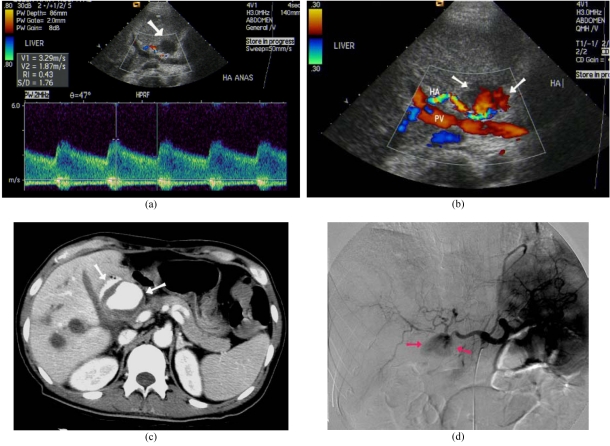
Figure 4.
Hepatic artery pseudo-aneurysm after LDLT. (a) Doppler US detected roundish hypoechoic lesion close to hepatic artery (arrow). Spectral Doppler demonstrated elevated peak systolic velocity at neck of pseudo-aneurysm. (b) Colour Doppler US revealed turbulent flow within the lesion (arrows). HA: Hepatic artery, PV: Portal vein. (c) Contrast enhanced CT showed pseudo-aneurysm (arrows). (d) Digital subtraction angiogram of celiac axis demonstrated pseudo-aneurysm (arrows).

