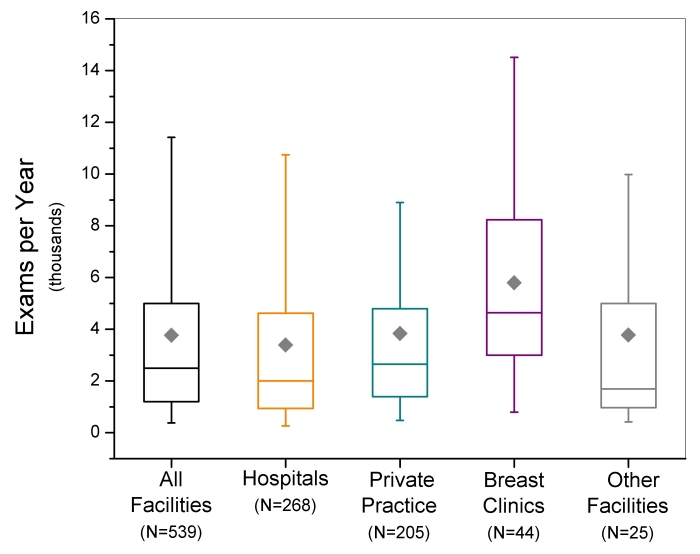
Figure 2.
Box-whisker plots of facility screening mammography workloads reported between January 2006 and October 2006. Box bottom and top borders are 25th and 75th percentiles respectively, and box contents are 50th percentile (line) and mean value (diamond). Whiskers indicate 5th and 95th percentiles.

