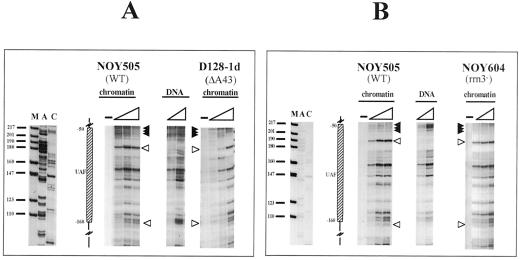
Figure 6.
Analysis of the UPE region: comparison of NOY505 (WT), D128-1d (RPA43 mutant), and NOY604 (RRN3 mutant). Samples were treated as in Figure 3. (A) Comparison between WT (NOY505) and RPA43 mutant (D128-1d). DNA, in vitro treated samples (0.1 and 0.2 U of DNAse I); NOY505 and D128–1d, in vivo treated samples. (B) Comparison of WT (NOY505) and RRN3 mutant (NOY604). DNA, in vitro treated samples (0.1 and 0.2 U of DNAse I); NOY505 and NOY604, in vivo treated samples. M, size marker (pBR322/MspI); lanes A and C: sequencing lanes. The schematic drawing indicates the UAF putative binding site and relative map positions. Protected areas are shown by black arrowheads; enhanced cleavages are shown by white arrowheads; triangles indicate increasing amounts of DNAse I in the treatment; −, untreated DNA.

