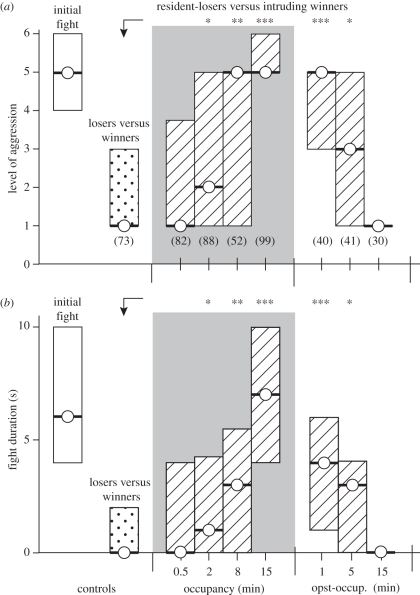
Figure 2.
Bar graphs illustrating the impact of shelter occupancy on (a) level of aggression and (b) fight duration (circle/bold line, median; bar, i.q.r.). For paradigm see figure 1b. From left to right: White bar, initial fight between naive males, stippled bar—losers versus winners 15 min after the initial fight; hatched bars/grey background, resident-losers versus intruding-winners after increasingly longer periods of shelter occupancy (0.5, 2.0, 8.0 and 15 min); hatched bars/white background, resident-losers versus intruding-winners after 15 min shelter occupancy followed by 1, 5 or 15 min isolation in the absence of the shelter (post-occup.). n is given in parentheses beneath each column, excepting initial fight, which is pooled. Asterisks denote statistically significant differences (Mann–Whitney U-test; *p < 0.05; **p < 0.01; ***p < 0.001).

