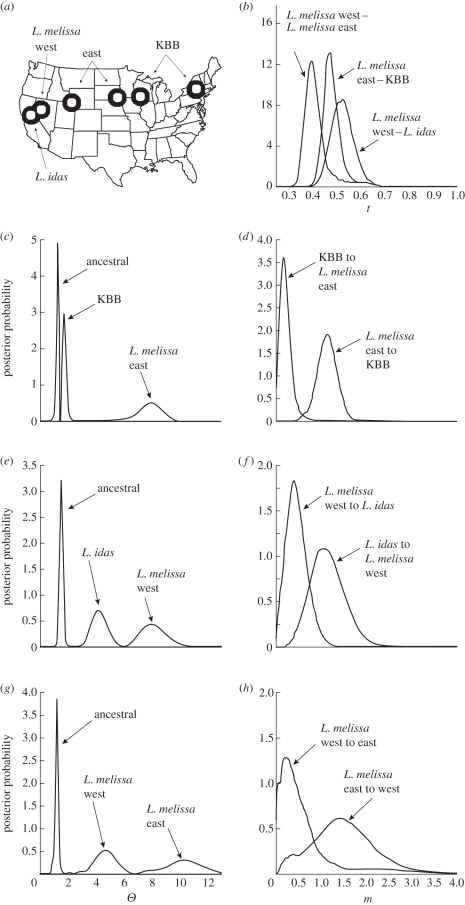
Figure 1.
(a) Map of sampled locations and taxa in North America and posterior probability distributions for parameters as follows: (b) splitting times, (c,e and g) populations sizes and (d,f and h) migration rates. Height of curves corresponds to the estimated probability that a given parameter value is true, given the data (95% confidence intervals are reported in table 1).

