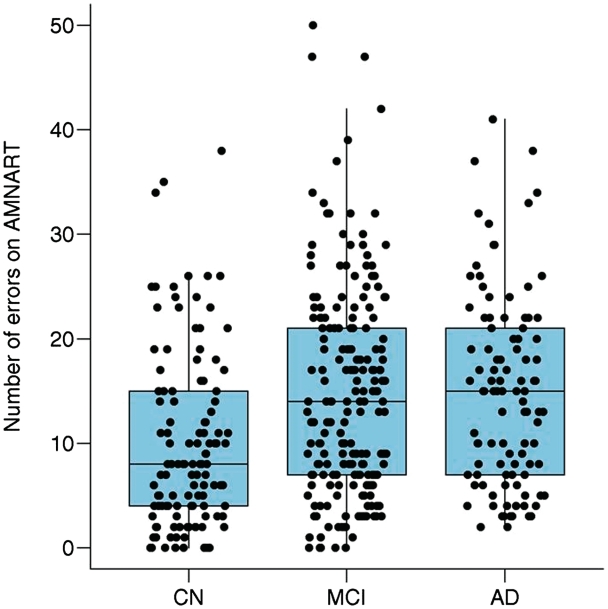
Figure 2.
Box plots of the distribution of AMNART errors by clinical group. The horizontal lines within each box represent the 25, 50 and 75th percentiles. The vertical lines extend out to the furthest point within 1.5 interquartile ranges of the box, where an interquartile range is the 75th minus the 25th percentiles. AD = Alzheimer's disease; CN = cognitively normal; MCI = mild cognitive impairment.

