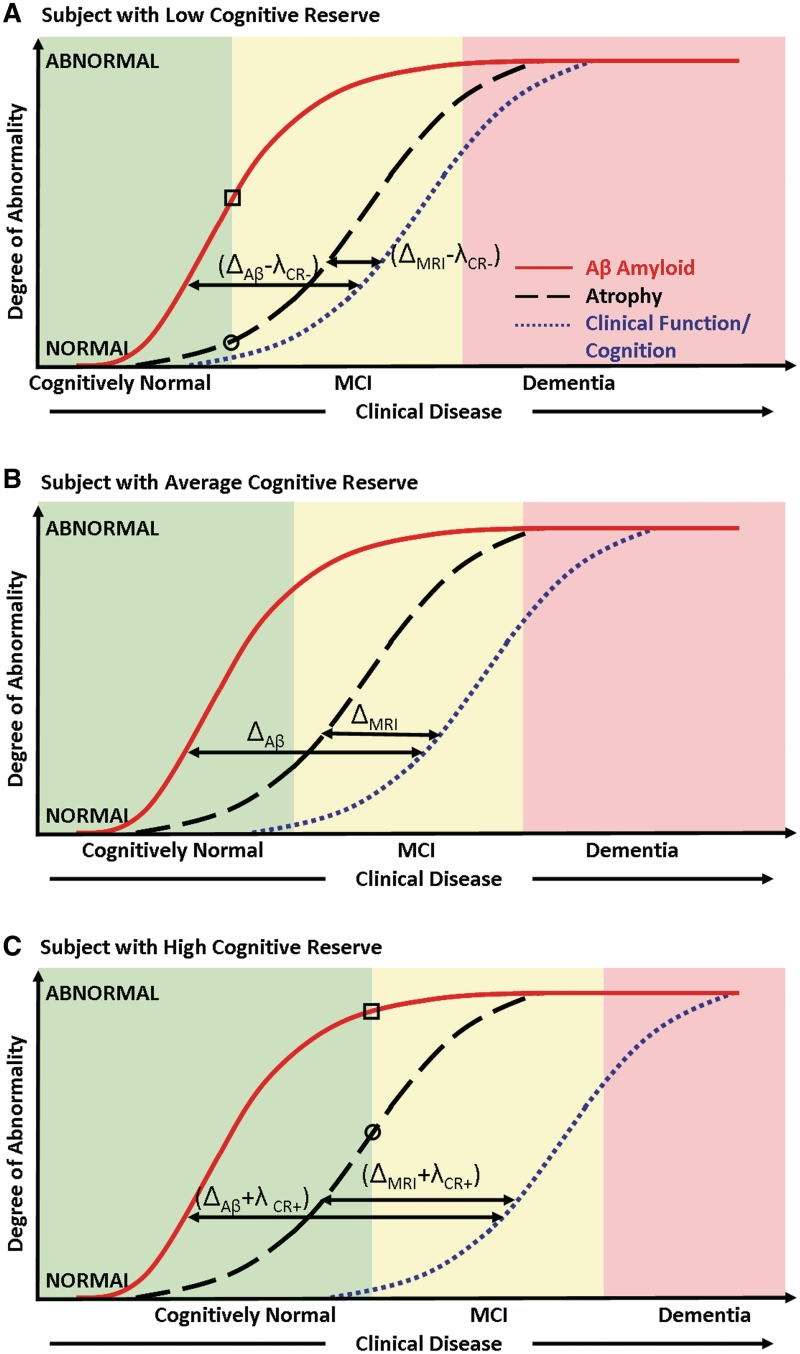
Figure 4.
Model illustrating the independent effect of cognitive reserve on the relationship between biomarkers of pathology and cognition in subjects with (A) low, (B) average and (C) high cognitive reserve. Clinical disease stage is indicated on the horizontal axis and the magnitude of biomarker abnormalities (from normal to maximally abnormal) on the vertical axis. The biomarker curve labels are indicated in A. In A and C, the levels of amyloid-β are indicated by a square and the levels of atrophy are indicated by a circle at the point where cognitively normal subjects progress to mild cognitive impairment. This illustrates that an equivalent clinical diagnostic threshold, subjects with high cognitive reserve have greater biomarker abnormalities than low cognitive reserve subjects. MCI = mild cognitive impairment.

