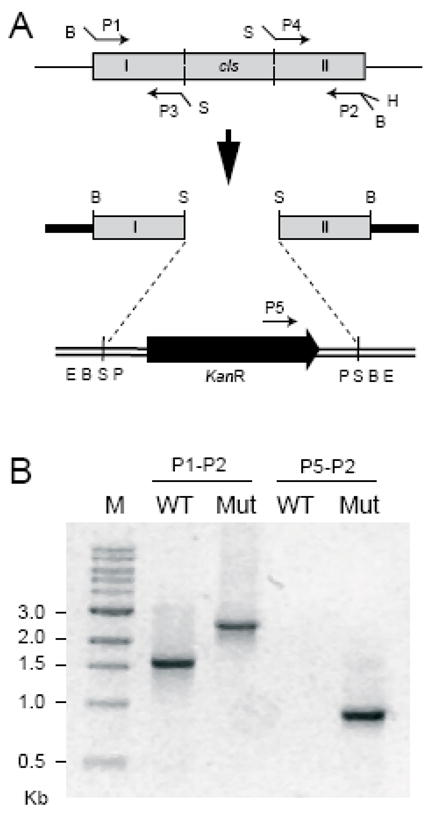
Figure 1.

Disruption of the cls gene. (A) Schematic diagram showing the gene disruption strategy. Grey boxes represent the cls gene and amplified segments of the gene. The black block arrow represents the kanamycin resistance cassette and the direction of the arrowhead shows its orientation. Plasmids pPICT-2 and pUC4K are shown as thick solid lines and double lines, respectively. Restriction sites: B, BamHI; S, SalI, H, HindIII; E, EcoRI; P, PstI. (B) PCR verification for the gene disruption. Genomic DNA was isolated from the type (WT) and the cls-deleted mutant (Mut) strains and two PCR reactions were carried out using different sets of primers placed at the positions indicated in Fig. 2A. The sizes of the PCR products were compared by gel electrophoresis. M indicates the marker lane.
