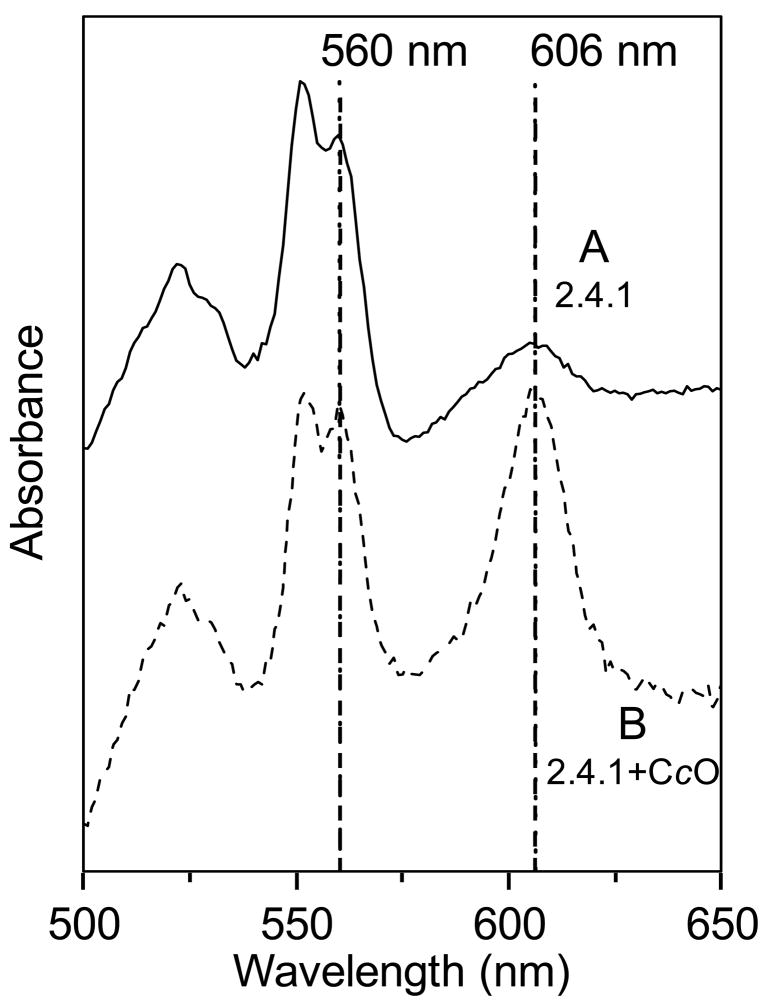
Figure 4.
Optical difference spectra of dithionite-reduced minus ferricyanide-oxidized solubilized membranes from A) R. sphaeroides strains 2.4.1 (wild-type) and B) 2.4.1+CcO (wild-type with CcO genes added on the expression plasmid PRK- pYJ123H). The relative levels of CcO are indicated by the sizes of the a-type heme absorbance peaks at 606 nm compared to the b-heme at 560 nm. The spectra are normalized to the 560 nm (b-type heme) peak. (Note that these membranes also contain the bc1 complex, a cbb3 type oxidase, and a membrane-bound cytochrome c which all contribute to the 560 nm and 550 nm peaks.)

