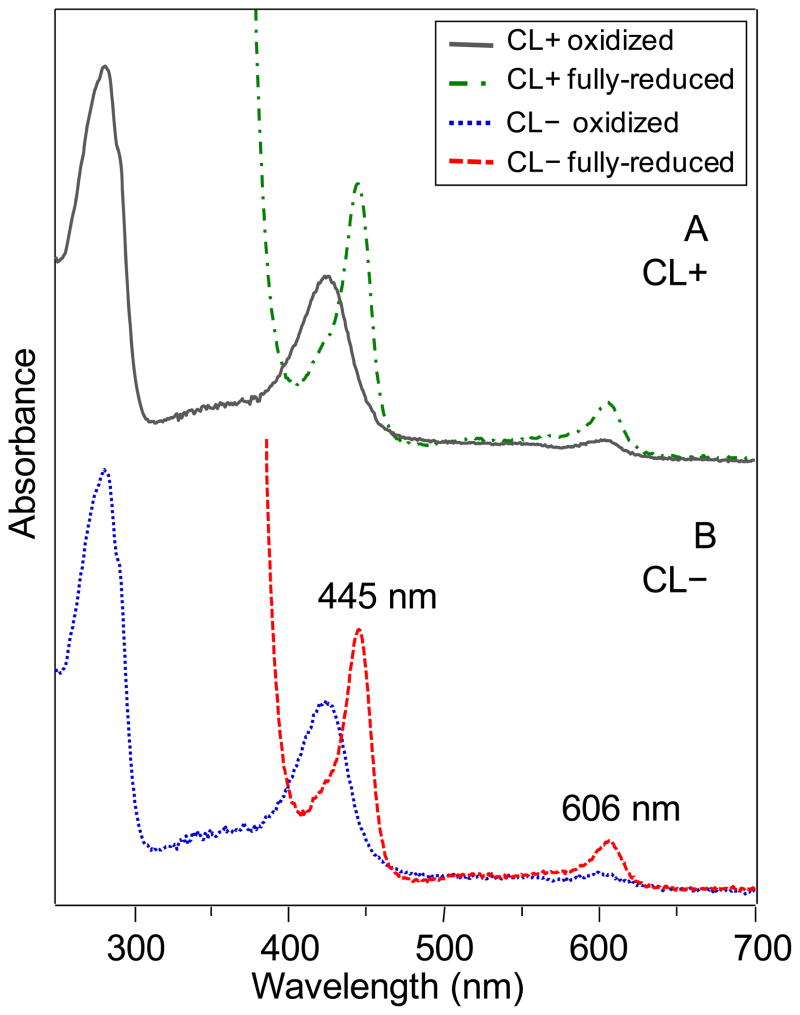
Figure 6.
Oxidized and reduced spectra of purified CcO samples used to produce protein crystals, purified from A) CL(+) (169WT) and B) CL(−) (169CL3) strains grown aerobically at 30 ºC. The reduced peaks at 445 and 606 nm, which are characteristic of the native heme a and a3 spectra, are seen to be at the same wavelengths in both CcO forms. These peaks have contributions of both hemes at both wavelengths. The spectra were acquired using the same CcO protein concentrations.

