Figure 7.
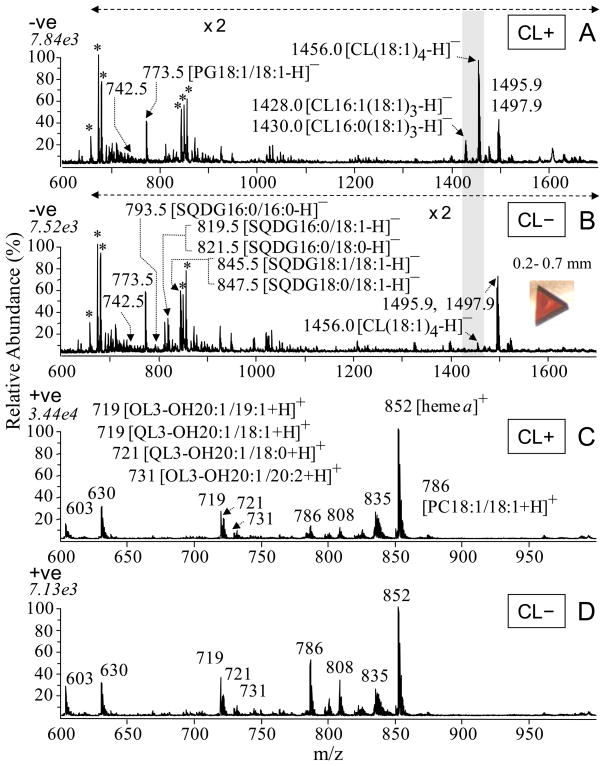
MALDI-MS spectra of the four-subunit CcO protein crystals from CL(+) (169WT) and CL(−) (169CL3) strains of R. sphaeroides in negative ion mode (A and B) and positive ion mode (C and D), showing a marked difference in CL content by relative peak height at m/z 1456 (highlighted). A) CcO from CL(+) in negative ion mode, B) CcO from CL(−) in negative ion mode, C) CcO from CL(+) in positive ion mode, D) CcO from CL(−) in positive ion mode. Ions labeled with asterisks were identified as 2,5-DHB matrix cluster adducts. The identities of labeled ions in each spectrum were confirmed by MS/MS experiments. Inset in B: photo of a typical four-subunit CcO crystal used in this analysis.

