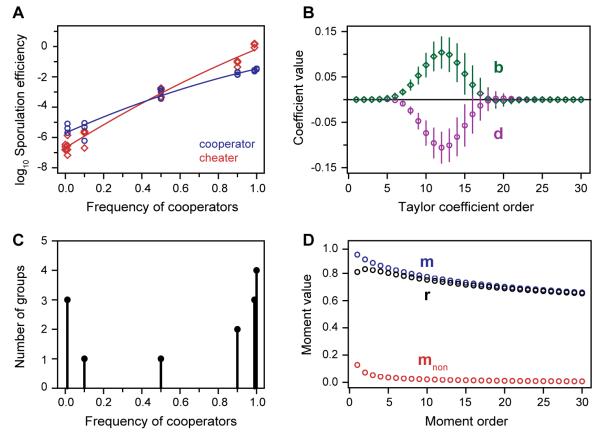
Fig. 2.
Parameters of the generalized Hamilton’s rule measured in an experimental population of sporulating Myxococcus bacteria. (A) Absolute fitness of a cooperator strain (blue circles) and a cheater strain (red diamonds) as a function of their frequency within groups. Data points: independent experimental replicates. Lines: regression model fit to data. (B) Fitness terms in equation (1), calculated from the data shown in (A). Green diamonds: benefit vector b. Purple circles: genotype-dependence vector d. Points show best-fit model ± SD from bootstrapped data. (C) Initial distribution of cooperators among groups for a specific experimental population. (D) Social structure terms in equation (1), calculated for the population shown in (C). Blue: cooperator moments m. Red: noncooperator moments mnon. Black: relatedness vector r.

