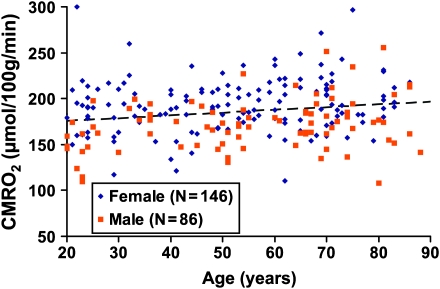
Figure 4.
Scatter plot between global CMRO2 and age (total N = 232). The data from women and men are shown with different symbols. The dashed line is a linear fitting of the experimental data. Regression analysis showed that age has a positive effect on CMRO2 (P = 0.0101). Women showed higher CMRO2 compared with men (P < 0.0001).

