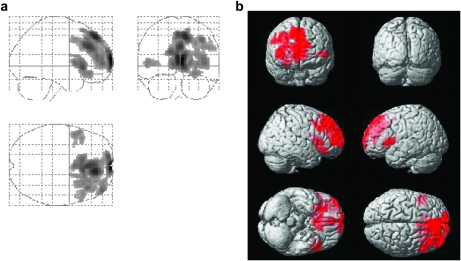
Figure 6.
Results of voxel-based analysis of CBF decreases with age. The left panel (a) shows the glass brain overlay, and the right panel (b) shows the rendering on the Montreal Neurological Institute brain template. Colored voxels indicate brain regions with age-related CBF decrease (P < 0.005, cluster size = 200 voxels). The differences are most pronounced in the rostral half of the brain and are more prominent in the right hemisphere.

