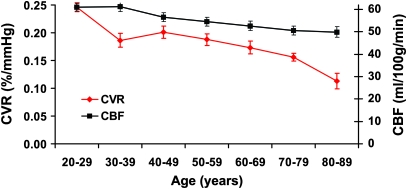
Figure 8.
Decade-by-decade alterations in prefrontal CVR and CBF. Display scales for CVR and CBF are shown on the left and right axis, respectively. The display scales were set such that the first points of the 2 curves overlapped. It can be seen that CVR manifests a more rapid decay with age compared with CBF. The subjects in each decade were grouped, and the data shown are the mean and standard error of the group.

