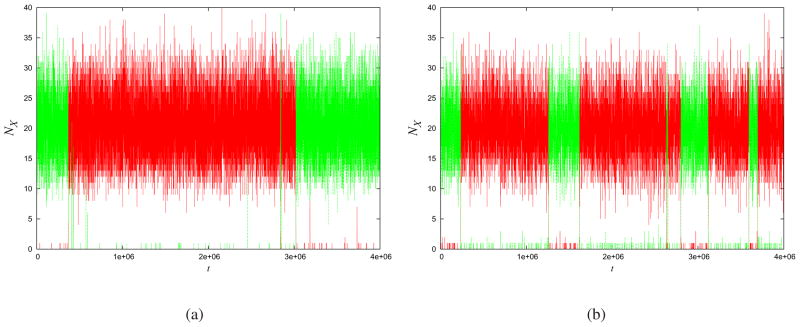
Fig.3. Levels of promoter unbound protein A(red) and levels of unbound protein B(green).
(a) Toggle-switch trajectory generated by Gillespie model. Computer-generated trajectories using the parameters d = 0.005, k = 0.1, f = 2 and r = 0.01. The time trace was broken up into time intervals δt = 0.1. Applying MaxCal to the trajectories from (a), we extracted the Lagrange multiplier K = −0.380 and use hα = hβ = −4.605 and hA = hB = 7.6. (b) MaxCal model with parameters extracted from the simulations. Representative trajectories generated using those values in the MaxCal model.

