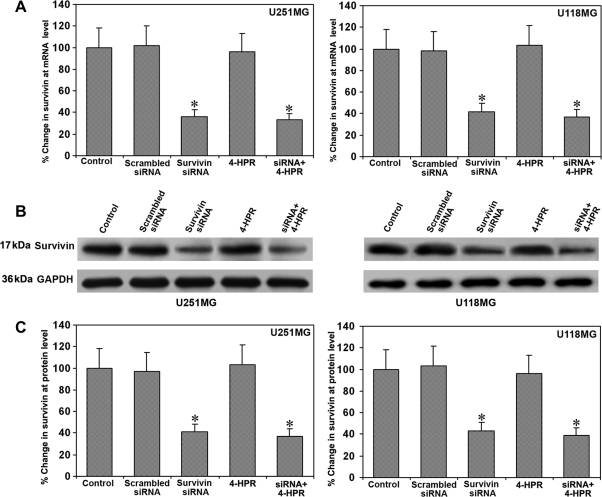
Fig. 1.
Survivin mRNA and protein levels in U251MG and U118MG cells. Treatments (48 hours): control, scrambled siRNA, survivin siRNA, 1 µM 4-HPR, and survivin siRNA + 1 µM 4-HPR. (A) Real-time RT–PCR analysis for survivin mRNA. Values are mean ± SD of 6 assays in each group (*P < .001 compared with the control mean values). (B) Western blotting for survivin. The blots were reprobed for GAPDH content to demonstrate that an equal amount of protein was loaded in each lane. The data are representative of 6 independent experiments. (C) Quantitative evaluation of Western blots. Values are mean ± SD of 6 assays in each group (*P < .001 compared with the control mean values).

