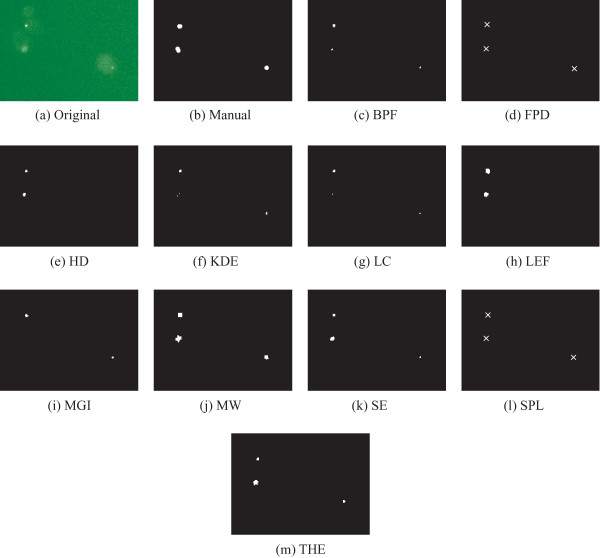
Figure 6.
Example frame of yeast P-body image stacks and detection results by the algorithms. Manually marked objects in reference result are also shown for the same area. Note that the objects detected by FPD and SPL are illustrated as crosses whereas the actual segmentation results are shown for other algorithms. Note that the parameters of different methods are tuned for the whole dataset, not for this particular image. The original image has been enhanced for illustration purposes.

