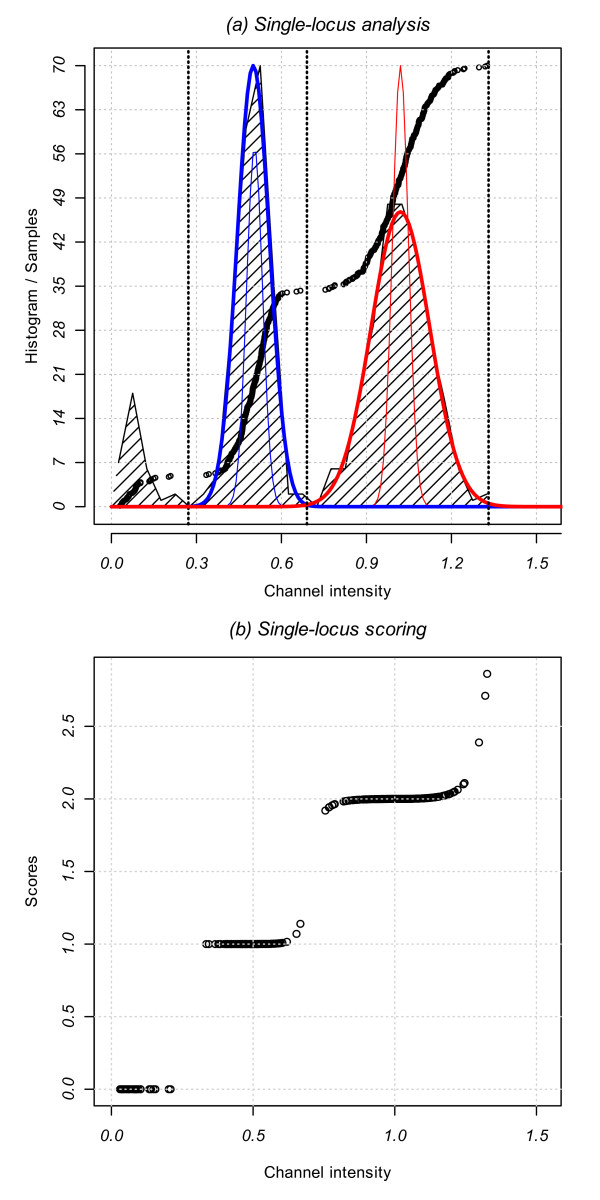
Figure 3.
Single-locus analysis. (a) CNstream performs a GMM fitting over the intensities of the samples on each channel (black circles). The zero copy intensity thresholds are determined and a two-component GMM is fitted (one copy in blue and two copies in red). The thin colour lines represent the initial model, and the thick lines represent the final model after EM fitting. (b) Channel intensity of the samples for one channel within one probe versus scores assigned by CNstream.

