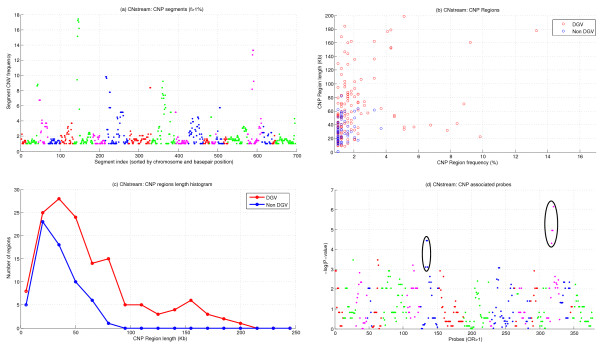
Figure 4.
CNstream results. (a) CNV frequencies of the 697 segments of five consecutive probes that exceeded the 1% frequency filter, sorted by chromosome and basepair position. (b) Length and frequency distribution of the 206 CNP regions. The colours indicate whether the regions match a DGV region or not. (c) Comparison between the CNP length histograms of the CNP regions. (d) P-values of the 353 segments with an OR > 1. Associated regions in 8p22 and 19p12 have been highlighted.

