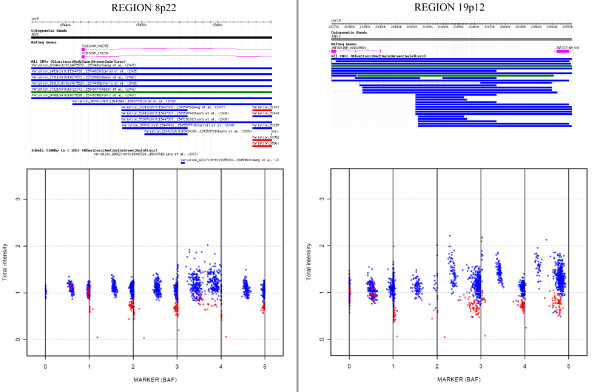
Figure 5.
CNstream: Top candidate regions. The top figures present the information detailed in the DGV for the two most associated regions detected by CNstream. Both have been previously identified as CNV regions and, principally, as deletion loci (blue lines). The lower figures demonstrate the distribution of the BAF and the normalized intensities along the five probes of the segment for the samples that have deletions (in red) and those that are detected as diploid (in blue).

