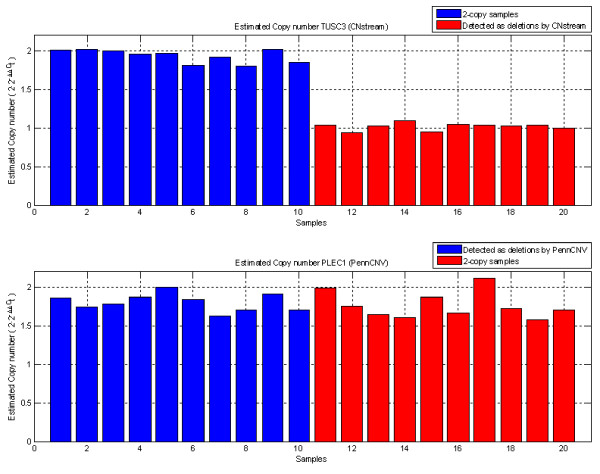
Figure 6.
Quantitative PCR results. (a) ΔΔCT values for 20 individuals for the TUSC3 locus, which clearly validate the deletions assigned by CNstream (red bars) versus the 2-copy samples (blue bars). (b) ΔΔCt values for the 20 individuals analyzed for the PLEC1 locus demonstrate no differences between those that were called with a deletion (in blue) and those that were called as 2-copy samples (in red) by PennCNV.

