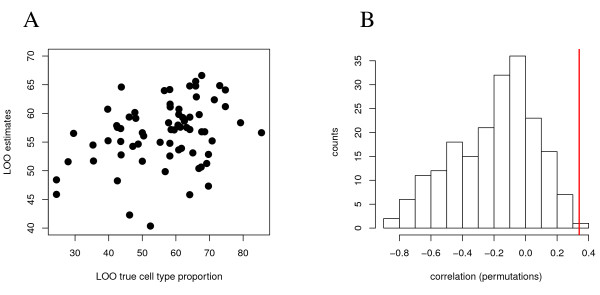
Figure 10.
Prediction of cell type proportions of single whole blood marker expression profiles. A leave-one-out cross validation approach was used to predict cell type proportions (CD3+) in single samples from their marker gene expression profiles (CD3G and MARCO). A: Scatterplot of estimated CD3+ proportions against true proportions (r = 0.34). B: Significance of this prediction precision based on 200 permutations of the true CD3+ proportions and identical analysis as for (A).

