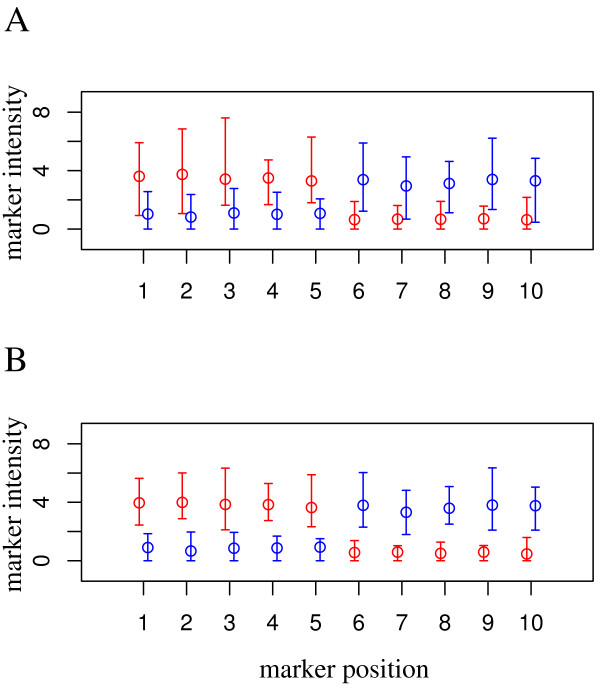
Figure 7.
Cell type-specific assignment using markers. Mean and range for marker intensities after deconfounding without (A) and with quantile normalization (B). Cell-types CD3+(red) and Other (blue). The first five marker positions are positive markers (exclusively expressed in CD3+), the remaining five are negative markers (not expressed in CD3+).

