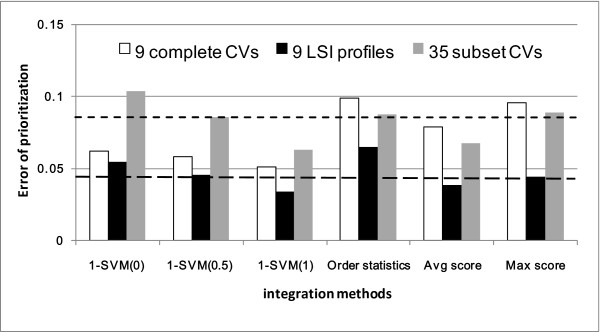
Figure 4.
Prioritization results obtained by multi-view data integration. The first and the second dotted horizontal lines represent the errors of the best single complete CV profile and the best single LSI profile respectively. To prove the statistical significance between the two closest performance, we used the paired t-test to compare the Error values of the 1-SVM (1) with LSI profile integration with the values of MeSH LSI profile obtained in 20 repetitions, the p-value was 2.67e-004.

