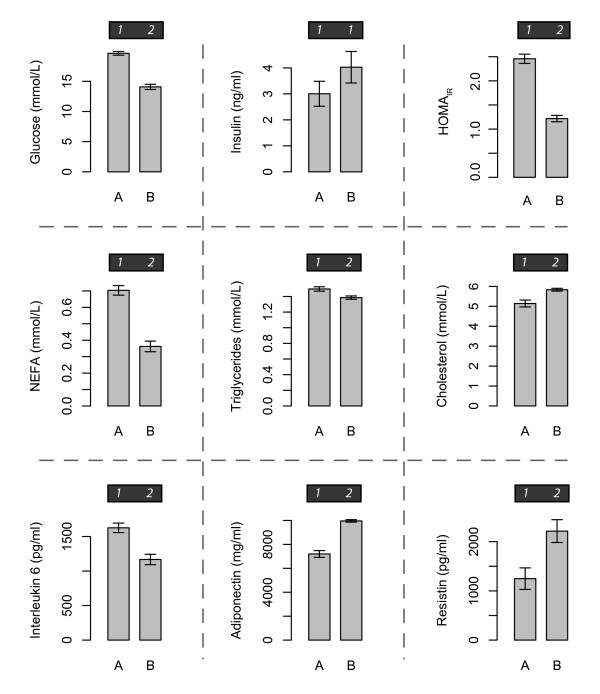
Figure 1.
Changes in plasma markers of MetS, in response to dietary fat modification: A = control LA-enriched diet; B = high-c9,t11 CLA beef enriched diet. Error bars represent standard error of the mean. Numbers above plots indicate statistically distinct groups (i.e., different numbers represent significant (α = 0.05) differences between diet groups).

