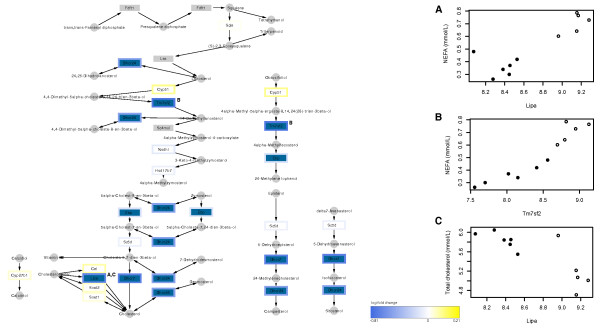
Figure 7.
High-CLA beef induced expression changes to steroid biosynthesis. Genes indicated in dark blue showed significant change in expression given the high-CLA diet (raw p-value < 0.05). Genes indicated in white were not significantly changed or showed very low expression and were removed from the dataset, while those in grey were not tested on the microarray. Node border indicates log-fold change using heatmap colours, as described in the figure legend, and small, round nodes represent nutrients/metabolites. Scatterplots illustrate the strongest three gene-plasma markers correlations. In the scatterplots, open circles represent control diet-fed animals, and filled circles represent high-CLA beef-fed animals.

