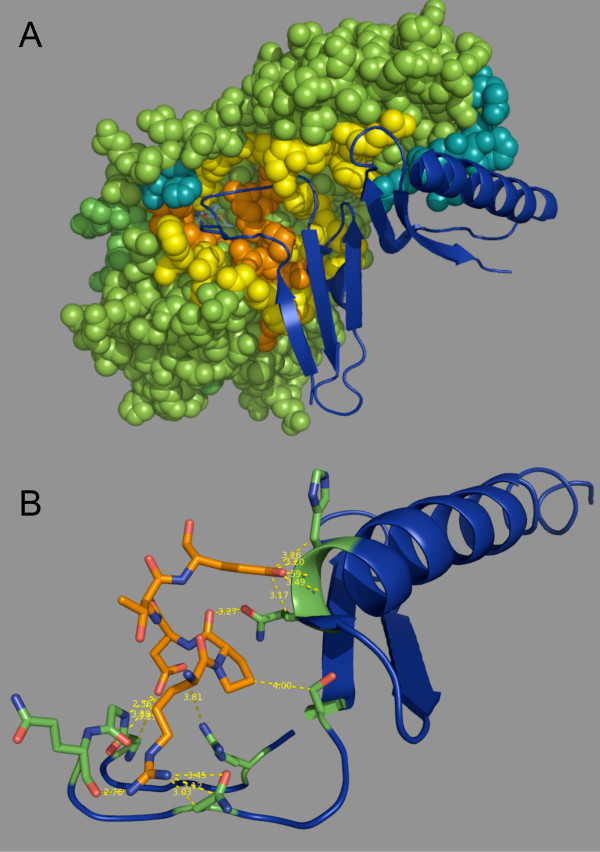
Figure 7.
Structural mapping of PrmC SIMBAL hotspots. A) PrmC is shown as a space-filling model. Subsequences C and E are shown in orange, others in yellow. Deeper colors indicate residues in contact with the RF-1 substrate. Contact residues not identified by SIMBAL are shown in blue-green. All other PrmC residues are in green. Segments of RF-1 domains 2 and 3 in contact with PrmC are shown as a ribbon cartoon in blue. The SAM cofactor is shown at the bottom of the active site cleft as a stick model. B) A detail of the contacts made by the RPDTE motif of subsequence C. PrmC is shown in orange, contacted residues of RF-1 are in green, otherwise colored blue. Molecular models visualized with MacPyMOL http://www.pymol.org/.

