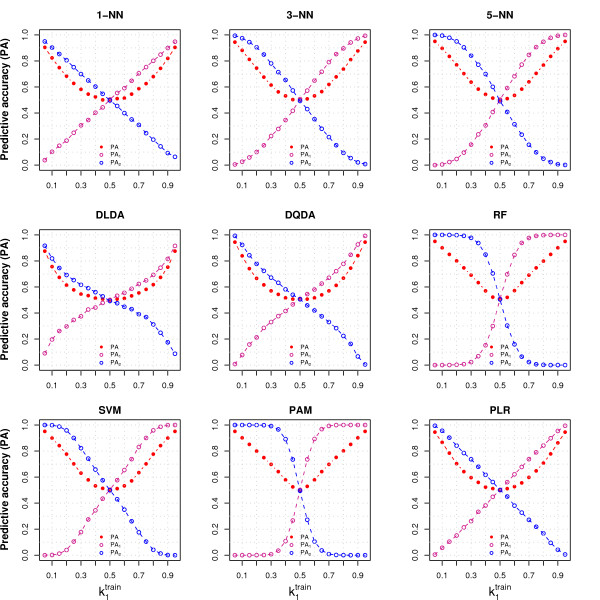
Figure 1.
Behavior of the classifiers under the null hypothesis with no variable selection. The figure shows the overall (PA) and class specific predictive accuracies (PA1 and PA2), varying the proportion of samples from Class 1 in the training set (), for nine classifiers. The training set contained 80 samples, and p = 40 variables were generated from the same distribution for both classes (N(0, 1)); no variable selection was performed (G = p). The proportion of Class 1 samples in the test set, containing 20 samples, was the same as in the training set. The PA were evaluated on the test set. Samples were mean centered. Details on data generation and on classifiers are reported in the Methods section.

