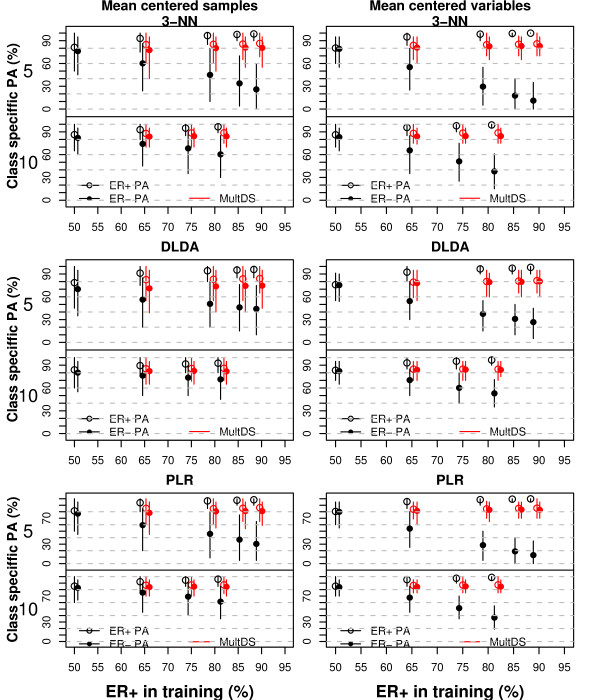
Figure 6.
Prediction of ER status. The figure shows the class specific predictive accuracies (dots, white for the ER+ and colored for the ER-class; expressed as %), and their 95% prediction intervals. The results reported in black and white refer to simple down-sizing, while those in red to multiple down-sizing. Five ER- samples (upper panels) or 10 ER-samples were included in the training set, while the number of ER+ samples was 5, 10, 20, 30 or 45. The test sets were balanced (20 ER- and 20 ER+ samples). The samples (left panels) or the variables (right panels) were mean-centered.

