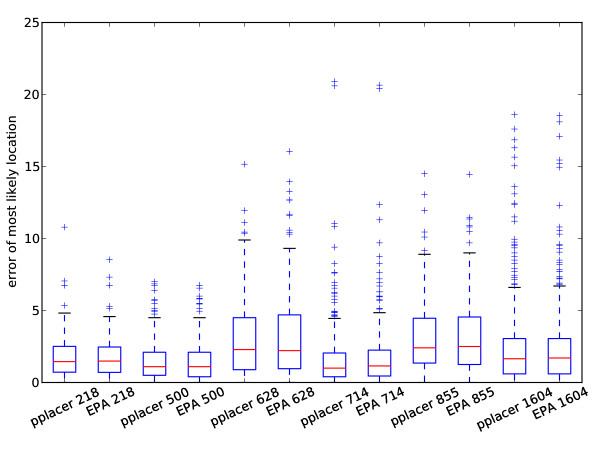
Figure 9.
Top placement accuracy comparison of pplacerand RAxML's EPA algorithm. Accuracy comparison between EPA and pplacer both run with the Γ model of rate variation, using reads of mean length 200 simulated from the test data sets from [28]. The x-axis numbers are the size of the data set used for simulation. The y-axis shows the error for the placement with the highest likelihood score.

