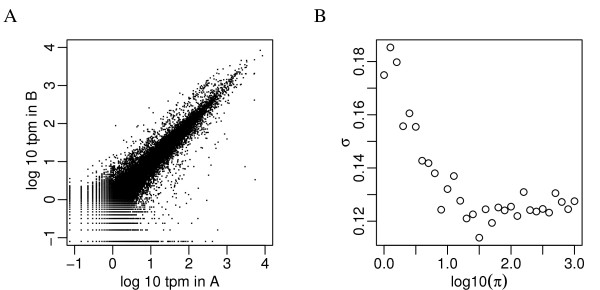
Figure 1.
Scatter plot of the log10 rpm in two samples. A. Scatter plot of the log10 rpm in two samples. The greater spread at lower counts suggests higher variance. B. Sample variance of log10 rpm from a simulation with constant biological variation shows that the increased sample variance may be caused by poor approximation of a Gaussian distribution to a Binomial distribution for sparse counts. To create the simulation dataset, we sampled log(π0) from observed average log counts and created log(π1) = log(π0) + δ/2 and log(π2) = log(π0) - δ/2 where δ ~ N (0, σ2). In this plot σ = 0.122, as estimated in the example data.

