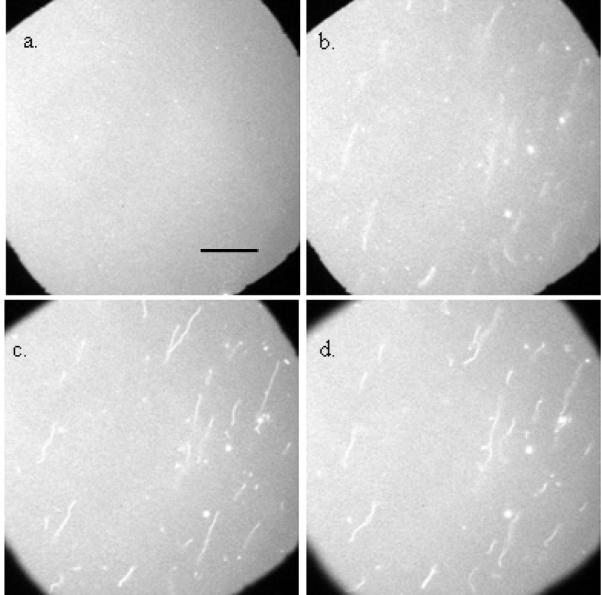
Figure 1.

Tubule formation in PC/PG bilayers: Epi-fluorescence images of an 84.75 mol % PC/15 mol % PG/0.25 mol % NBD-PC bilayer. All the images are acquired at the same spot. Bilayer images were acquired (a) before the addition of protein, and (b, c, d) after the addition of 2.6 μM α-synuclein. In images obtained after the protein addition, the bilayer is adjusted progressively out of focus. The scale bar represents 40 μm.
