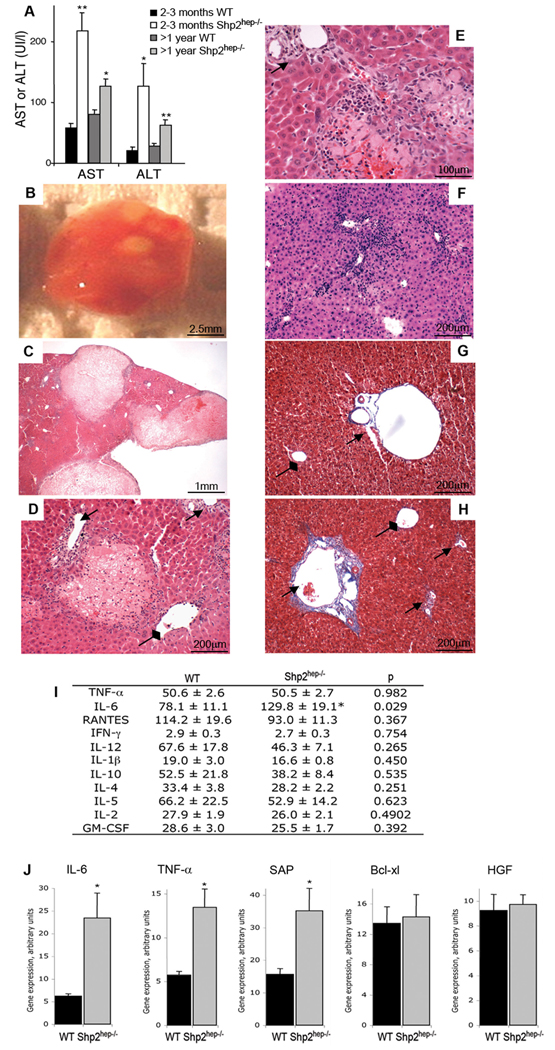
Figure 1. Hepatic damage and inflammation in Shp2hep−/− mice.
(A) Circulating blood levels of AST and ALT were quantified in control or Shp2hep−/− mice at indicated ages; n = 4–8, * p<0.05; ** p<0.01 for WT versus Shp2hep−/−.
(B) Gross appearance of the right lobe of a Shp2hep−/− liver showing pale acellular regions.
(C) H&E staining of a Shp2hep−/− liver section showed inflammation and macroscopic necrosis.
(D) H&E staining showed a small necrotic area surrounded and infiltrated by inflammatory cells in Shp2hep−/− liver section. In D–H, Arrows indicate portal triads and diamond arrow shows central vein.
(E) A necrosis area was surrounded by inflammatory infiltrates in H&E stained Shp2hep−/− liver section.
(F) H&E staining showed severe inflammatory infiltrates in Shp2hep−/− liver.
(G–H) Trichrome staining showed low and high levels of collagen secret surrounding the portal triad of control (G) and Shp2hep−/− (H) liver sections, respectively.
(I) Circulating blood levels of inflammatory cytokines were quantified at 2–3 months of age (n = 7–18, * p<0.05).
(J) Hepatic gene expression of IL-6, TNF, Bcl-xl and HGF was assessed by qRT-PCR of total mRNAs isolated from 2–3-month-old mouse livers. The results were average of 3 mice, and absolute mRNA values were determined and normalized to cyclophilin.
See also Figure S1.

