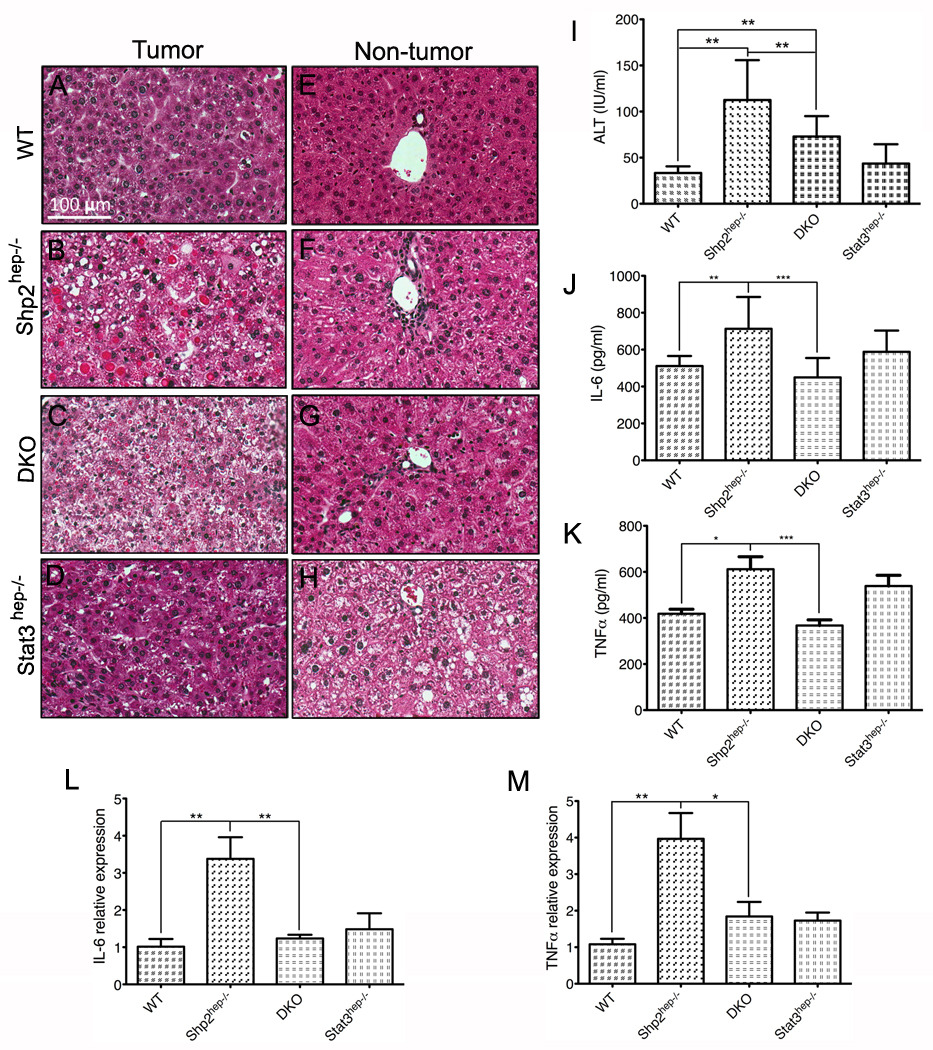
Figure 6. Increased inflammation in Shp2hep−/− livers is reduced by combined deletion of Shp2 and Stat3.
(A–D) Representative H&E staining of tumor samples showed typical trabecular structures in control and Stat3hep−/− livers, but not in Shp2hep−/− and DKO livers, and reduced size of eosinophilic vacuoles of degeneration in DKO liver.
(E–H) Representative H&E staining of liver samples showed infiltrate of inflammatory cells in portal triads of Shp2hep−/− and DKO livers, and fat droplets in Stat3hep−/− liver.
(I) Serum ALT levels were measured in the four groups of mice.
(J–K) IL-6 and TNFα levels in liver extracts were measured by ELISA.
(L–M) qRT-PCR was performed to determine IL-6 and TNFα mRNA levels.
(I–M: n = 5–11; * p<0.05; ** p<0.01; *** p<0.001).

