
Figure 2. Time course of edema.
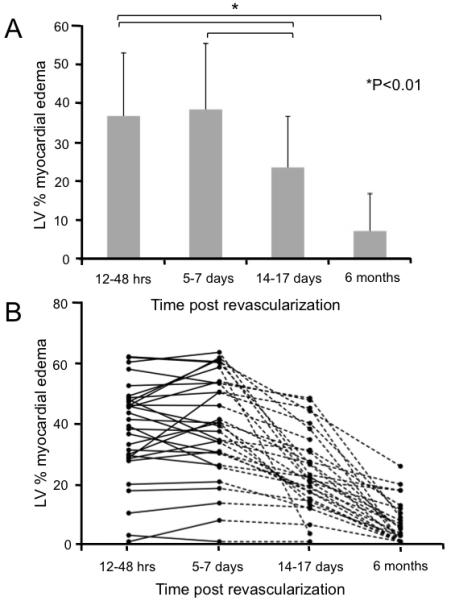
A Mean percentage of LV volume positive for myocardial edema at each time point. The volume of edema remained stable in the first week post event with a significant decrease at 15 -17 days with near resolution by 6 months. B. The time course of edema and resolution is given for each patient. There was a large range of LV % volume of edema (0 to 60%). This analysis on an individual level confirms the constancy of edema measured in the first 5-7 days, that is suggested in Panel A, with marked variation thereafter. Using the objective thresholding methods described in the text, a small number of patients had a substantial volume of apparent residual edema at 6 months.