
Figure 3.
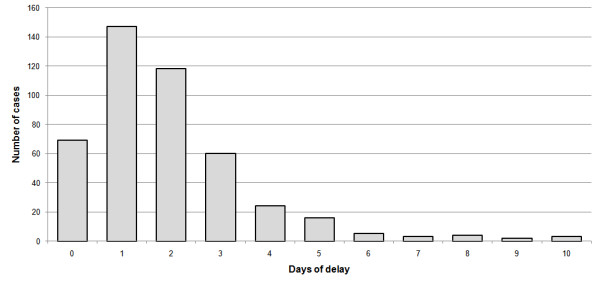
Delay between disease initiation and doctor visit. Frequency distribution of the number of days of delay between the reported initiation of the disease and the visit to the health clinic or hospital (N = 451).
Official websites use .gov
A
.gov website belongs to an official
government organization in the United States.
Secure .gov websites use HTTPS
A lock (
) or https:// means you've safely
connected to the .gov website. Share sensitive
information only on official, secure websites.
Delay between disease initiation and doctor visit. Frequency distribution of the number of days of delay between the reported initiation of the disease and the visit to the health clinic or hospital (N = 451).