
Figure 1.
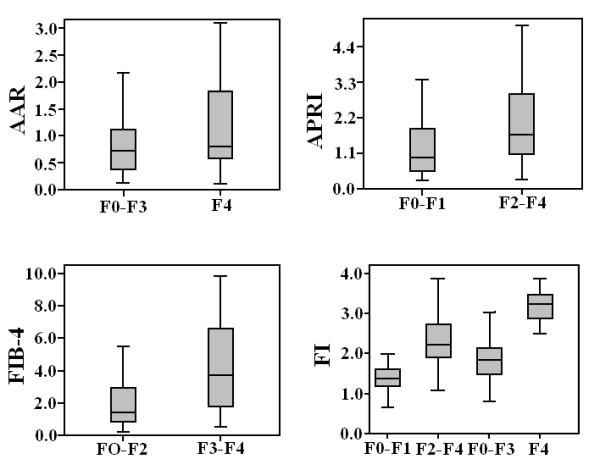
Box plots of the AAR, APRI, FIB-4 and FI for different fibrosis stages. The horizontal line inside each box represents the median, while the top and bottom of boxes represent the 25th and 75th percentiles, respectively. Vertical lines from the ends of the box encompass the extreme data points.