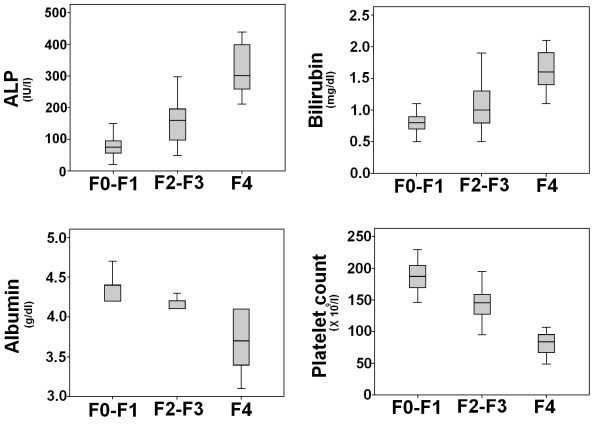
Figure 3.
Relationship between fibrosis stages and the ALP, bilirubin, serum albumin and fibrosis-cirrhosis index (FCI). The lines through the middle of the boxes represent the median, while the top and bottom of the boxes are the 25th and 75th percentiles. The error bars represent measurement range (maximum and minimum values).

