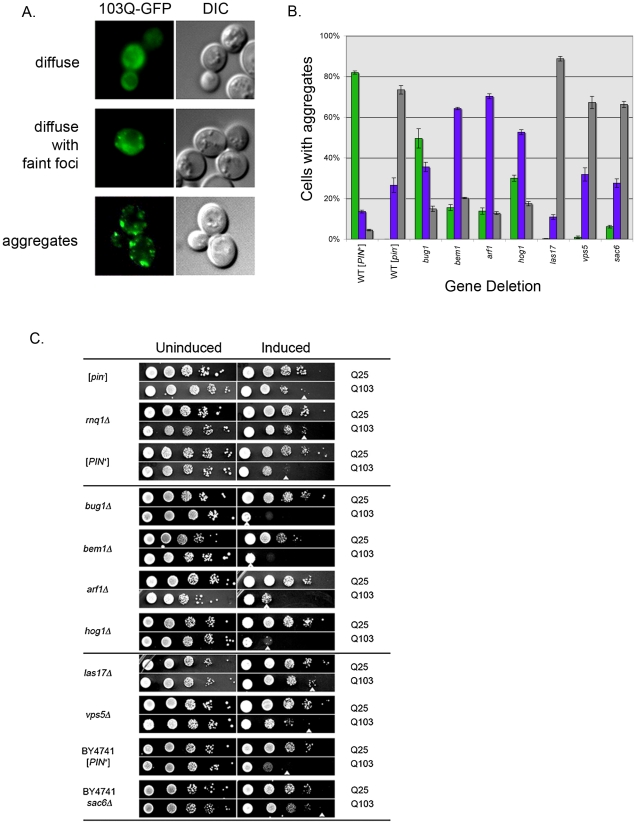
Figure 4. Aggregation and toxicity of 103Q in deletion strains.
A. Log phase wildtype [PIN +] cells containing the 103Q-GFP plasmid were induced in galactose containing media for one to two hours and then visualized. Within the population, most cells exhibited strong fluorescent aggregates on a non-fluorescent background (bottom), some cells had faint fluorescent foci on a cloudy fluorescent background (middle), and a very small population of cells had diffuse cytoplasmic fluorescence (top). B. Deletions containing 103Q-GFP were induced and scored for the different cell types indicated in (A). The percentages of cells containing strong fluorescent aggregates (green bars), faint foci (purple bars), and diffuse cytoplasmic fluorescence (gray bars) were calculated from over 300 cells from at least one transformant from each independent knock out line for a total of three transformants. C. Wildtype [PIN +], wildtype [pin −], rnq1Δ, and the indicated [PIN +] deletion strains were transformed with either the 103Q-GFP or 25Q-GFP plasmid and grown to late log phase in glucose (uninducing) media. Cells were serially diluted 20-fold and plated on media that either induced (right column; galactose containing media) or did not induce (left column; glucose containing media) the overexpression of the 25Q-GFP or 103Q-GFP plasmid. White arrowhead indicates the lowest dilution displaying growth. Deletion strains in (C) are in the 74D-694 background except sac6Δ, which is in the BY4741 [PIN +] background as indicated. Pictures shown are representative of the multiple independent deletion lines tested for 103Q-GFP toxicity.

