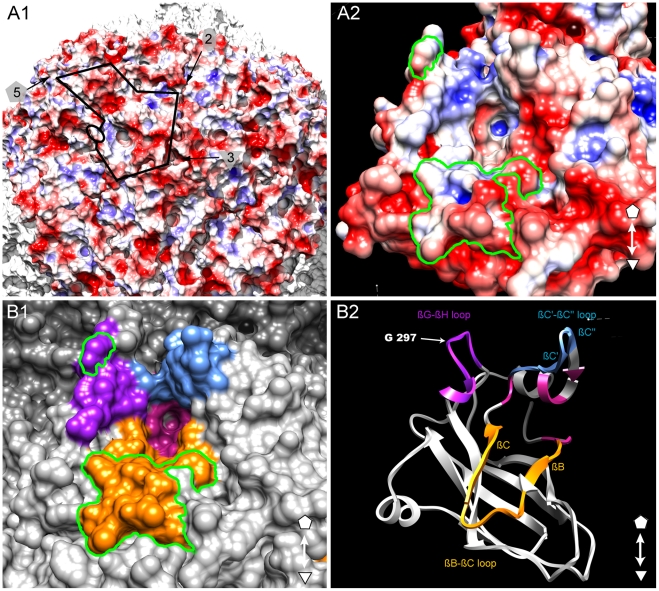
Figure 6. Putative ligand-binding pocket.
(A) Representation of the GFLV-F13 capsid with red, blue and white regions showing negative, positive and neutral electrostatic surface potentials, respectively. The black line highlights a single CP subunit and arrows denote the 5-, 3-, and 2-fold axes. (A1) Residue 297 is indicated by an open black circle on the left side of the positively charged pocket. (A2) Detailed view of the positively charged pocket. The electrostatic potential was calculated with APBS and visualized from -3 to 3 k/e- with Chimera using a probe of 3 Å to display a smoother surface. (B) Top views of the putative ligand-binding pocket at the surface of the GFLV-F13 capsid. (B1) View of GFLV-F13 outer-surface residues at the same magnification and orientation than in A2. Residues of the putative ligand-binding pocket are colored using the following color code: GH loop (purple), BC loop (yellow), C′C″ loop (blue) and base of the pocket (red). A green line delineates the Gly297 and region R2. (B2) Ribbon view of the putative ligand-binding pocket using the same color code as in B1.

